
A Step-by-Step Performance Tuning Guide
Quick Summary for System Admins:To monitor Java Heap memory in Oracle Analytics Server (OAS), log in to the Oracle WebLogic Administrative Console (usually port 9500). Navigate to Environment > Servers, select your target server (e.g., bi_server1), and click the Monitoring > Performance tab. Watch the Heap Free Percent; if it drops below 10%, you are at risk of an OutOfMemoryError.
Introduction
Oracle Analytics Server (OAS) is a robust Java-based application that relies heavily on the Java Development Kit (JDK) for resource management during runtime. As a system administrator, monitoring the Java Virtual Machine (JVM) heap usage is one of the most critical tasks you can perform to ensure system stability.
Without proper monitoring, your server is at risk of performance degradation or critical crashes caused by memory exhaustion. This guide will walk you through exactly how to monitor Java heap memory using the Oracle WebLogic Administration Console.
Why Monitor JDK Heap Size?
The “Heap” is the memory area where Java objects reside. When OAS runs complex reports or handles high user loads, this memory fills up.
If the Heap Free Current (available memory) drops too low, the JVM cannot allocate memory for new processes. This results in the dreaded error:
java.lang.OutOfMemoryError: Java heap space
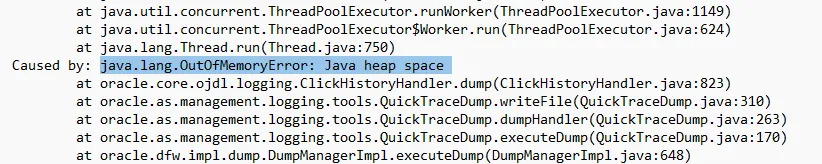
When this occurs, the server may hang or crash. These errors are typically logged in the diagnostic files specific to your server instances, which are invaluable for troubleshooting:
- AdminServer-diagnostic.log
- bi_server1-diagnostic.log
Step-by-Step Guide: Monitoring Heap Memory
To view the current Java heap memory statistics, follow these steps within the Oracle WebLogic Console.
1. Access the Console
Launch the WebLogic Administrative Console. By default, the URL usually follows this format:http://ServerHost:9500/console
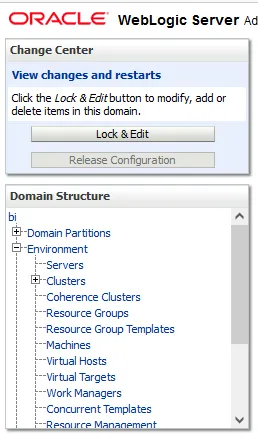
2. Navigate to Servers
On the left-hand navigation pane, navigate to:Environment > Servers
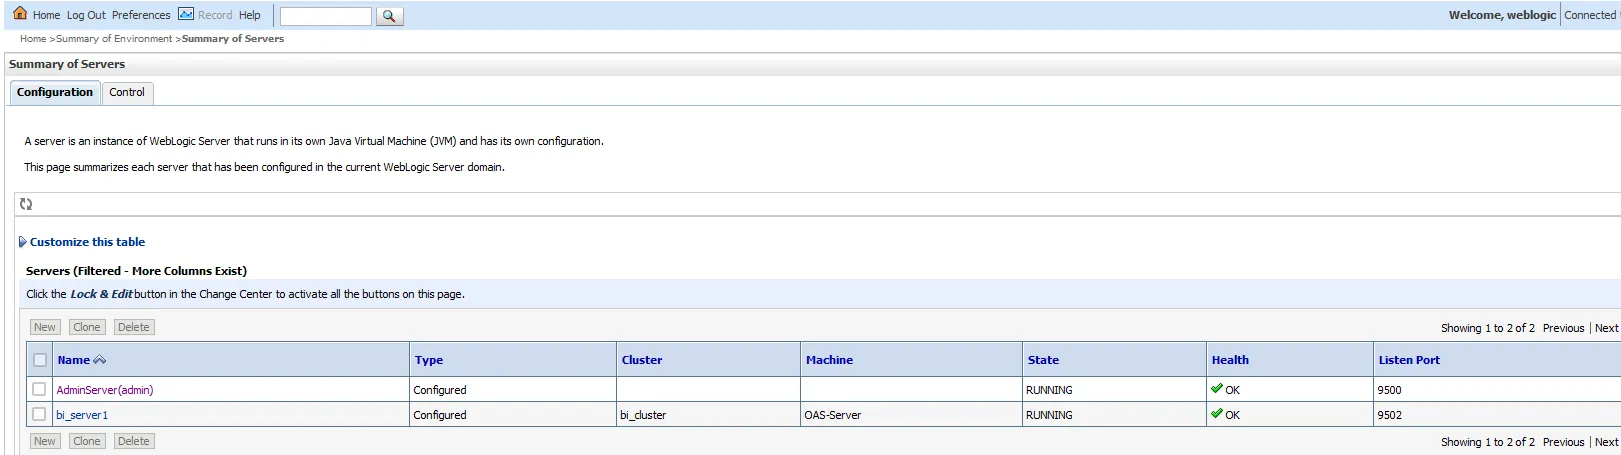
You will see a summary of your environment. Typically, an OAS environment consists of two main server instances:
- AdminServer(admin): The central control hub.
- bi_server1: The managed server handling the Business Intelligence workload.
3. Monitor the AdminServer
- Click on the link for AdminServer(admin).
- Select the Monitoring tab at the top.

- Click on the Performance sub-tab.
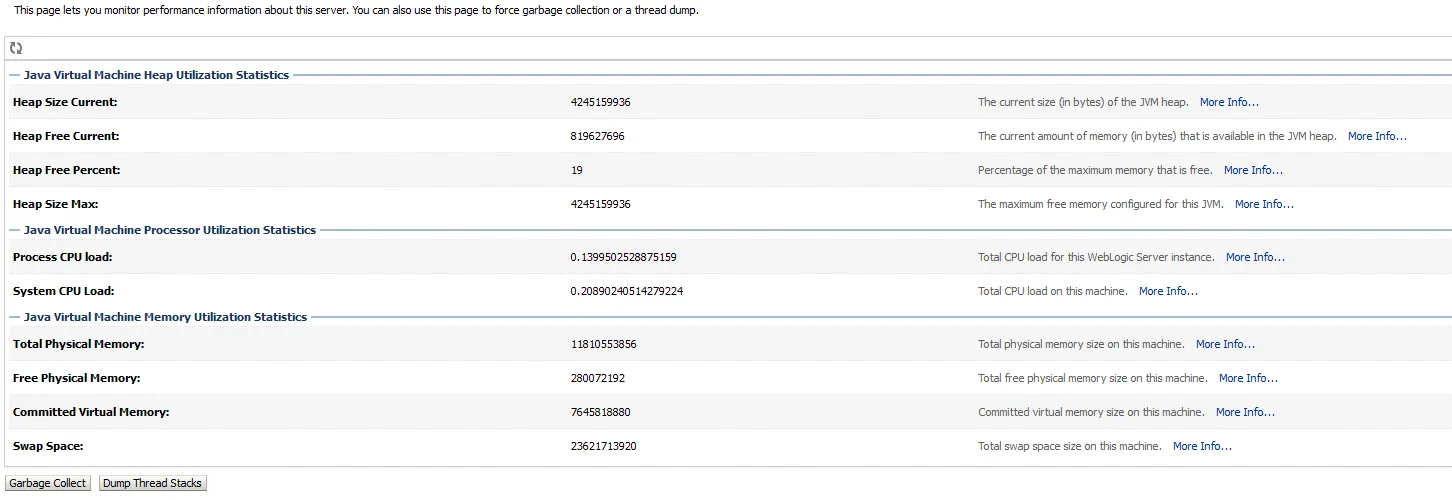
Understanding the Metrics:
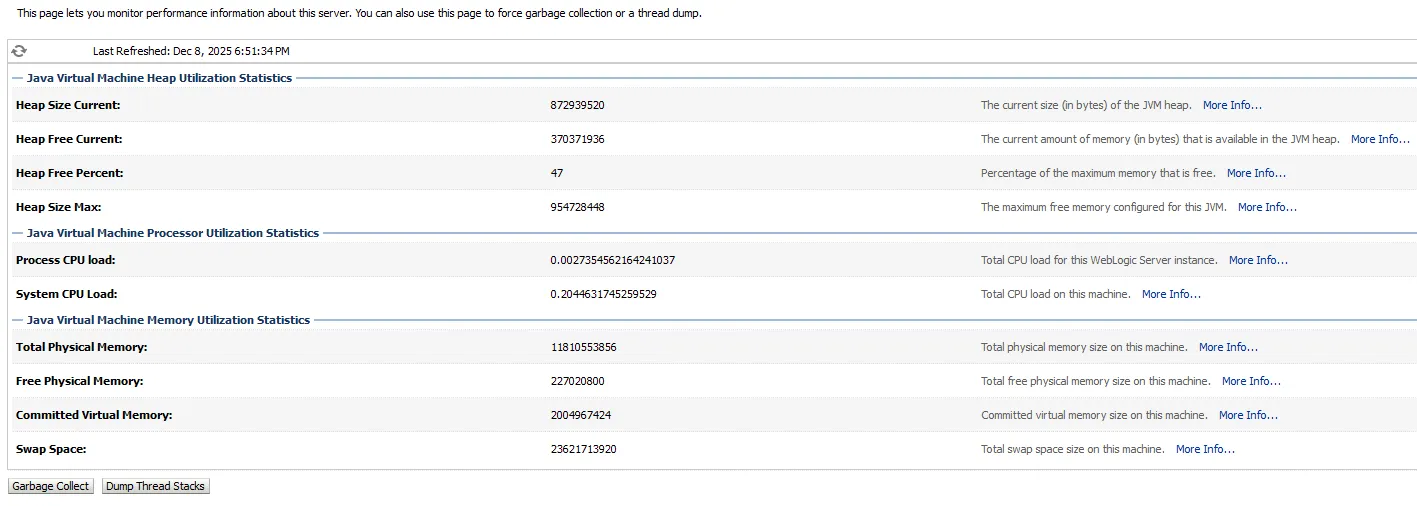
Here you will see a real-time dashboard of the JVM’s health. The specific fields to watch are:
| Metric | Definition |
| Heap Size Current | The total size (in bytes) of the memory currently allocated to the JVM heap. |
| Heap Free Current | The actual amount of memory (in bytes) currently available for new objects. |
| Heap Free Percent | The percentage of the maximum memory that is currently free. This is your key health indicator. |
| Heap Size Max | The hard limit of memory the JVM can grab from the OS. |
4. Monitor the BI Server (bi_server1)
The bi_server1 instance usually handles the heavy lifting for analytics reports, making it more prone to memory spikes.
- Go back to Environment > Servers.
- Click on bi_server1.
- Click the Monitoring
- Click the Performancesub-tab.
Same previously mentioned parameteres for AdminServer(admin)
Interpreting the Data: When to Worry?
Simply seeing the numbers isn’t enough; you need to know when to take action.
- Healthy State:A healthy server often fluctuates, but the “Heap Free Percent” should generally stay above 30-40% after garbage collection cycles.
- Warning State:If you consistently see the “Heap Free Percent” hovering between 15-20%, the server is under stress.
- Critical State:If free memory drops below 5-10% and stays there, an OutOfMemoryError is imminent. Garbage collection will run frequently (CPU spikes), killing performance before the server eventually crashes.
How to Fix Low Memory
If you notice your Heap Free Current is constantly critical, monitoring alone won’t save the server. You need to tune the JVM parameters. This typically involves:
- Locating your sh(Linux) or setDomainEnv.cmd (Windows) script.
- Adjusting the -Xms(Initial Heap) and -Xmx (Max Heap) arguments.
- Recommendation:Increase the -Xmx value to allow OAS more headroom, ensuring the physical server has enough RAM to support the increase.
Frequently Asked Questions (FAQ)
Q: What causes java.lang.OutOfMemoryError in Oracle Analytics?A: This occurs when the JVM runs out of space in the heap to store new objects. Common causes include undersized JVM configurations, memory leaks in custom code, or attempting to process datasets larger than available RAM.
Q: How often should I check these metrics?A: For critical production environments, it is recommended to use an automated monitoring tool (like Oracle Enterprise Manager) to alert you when Heap Free Percent drops below a specific threshold (e.g., 20%).
Q: How do I check memory usage in Oracle Analytics Server (OAS)?A: Log in to the WebLogic Administration Console, navigate to Environment > Servers, select your target server (e.g., bi_server1), and open the Monitoring > Performance tab.
Q: Where can I find memory error logs in WebLogic?A: Memory errors like java.lang.OutOfMemoryError are written to the diagnostic logs, located by default in the server’s logs directory. Look for files named AdminServer-diagnostic.log or bi_server1-diagnostic.log.
Q: What is a good Heap Free Percent for WebLogic?A: While it varies by workload, maintaining a Heap Free Percent above 30% is generally considered healthy. Consistent dips below 15% indicate a need for tuning.
Q: Can I view these metrics without logging into the console?A: Yes, these metrics are exposed via JMX (Java Management Extensions) and can be consumed by third-party monitoring tools like Nagios, Splunk, or Prometheus.