Oracle Analytics Server monitoring best practices:
Oracle Analytics Server monitoring via Enterprise Manager (EM) allows administrators to proactively track system health, visualize JVM heap usage, and manage BI domain performance. By leveraging Fusion Middleware Control, users can oversee WebLogic deployments, ensure high availability through clustering, and troubleshoot critical server metrics like CPU load and port status.
Key Takeaways
- Holistic Visibility:Monitor the entire BI Domain, including Admin and Managed Servers, from a single pane of glass within WebLogic.
- Critical Metrics:Focus daily checks on Server Status, Listen Ports, CPU load, and Java Heap usage to prevent downtime.
- Scalability & Tuning:Utilize Failover and Scale Out features within EM to enhance system availability and optimize performance parameters.
1. Oracle Analytics Server System Architecture
To effectively monitor OAS, it is crucial to understand the logical architecture. The OAS system is hosted under the WebLogic Middleware Server. The logical system architecture comprises a single integrated set of manageable components called the BI Domain.

Core Components of the BI Domain
The BI Domain can be installed on a single host or clustered across multiple hosts for high performance. It consists of the following key components:
- Administration Server:Deployed as a JEE container, this runs in a dedicated Java virtual machine. It houses components for administering the system, including the Oracle WebLogic Server Administration Console and Oracle Fusion Middleware Control.
- Managed Server (bi_server1):Also a JEE container, this provides the runtime environment for Java-based services such as Publisher and Presentation Services. A BI domain may contain multiple Managed Servers distributed across hosts.
- Node Manager:Provides process management services for the Admin Server, Managed Server processes, and System Components.
- System Components:Deployed as server processes that provide core services (non-JEE).
- Other Domain Contents:Includes configuration files, metadata, WLST commands, security, and database connection information.
2. Server Monitoring via Enterprise Manager
Effective monitoring requires a daily routine. Fusion Middleware Control (Enterprise Manager) is the primary tool for this, allowing you to view and graph available metrics.
How to Access Performance Metrics
Data logging is transient, meaning it begins only when you select a metric for display. Follow these steps to access the Performance Summary:
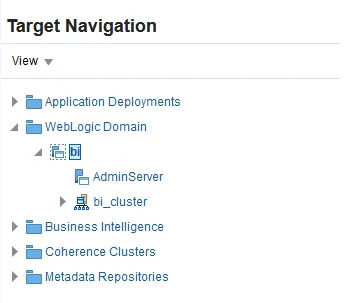
- Navigate the Tree:In the tree navigator, expand the Business Intelligence
- Select Instance:Right-click the biinstance
- Open Monitoring:Select Monitoring > Performance Summary.
- Customize View:Click Show Metric Palette to expand categories and select specific metrics to display on the dashboard.
Dashboard Overview
Upon logging into Enterprise Manager, you will typically see two main servers: the AdminServer and bi_server1.
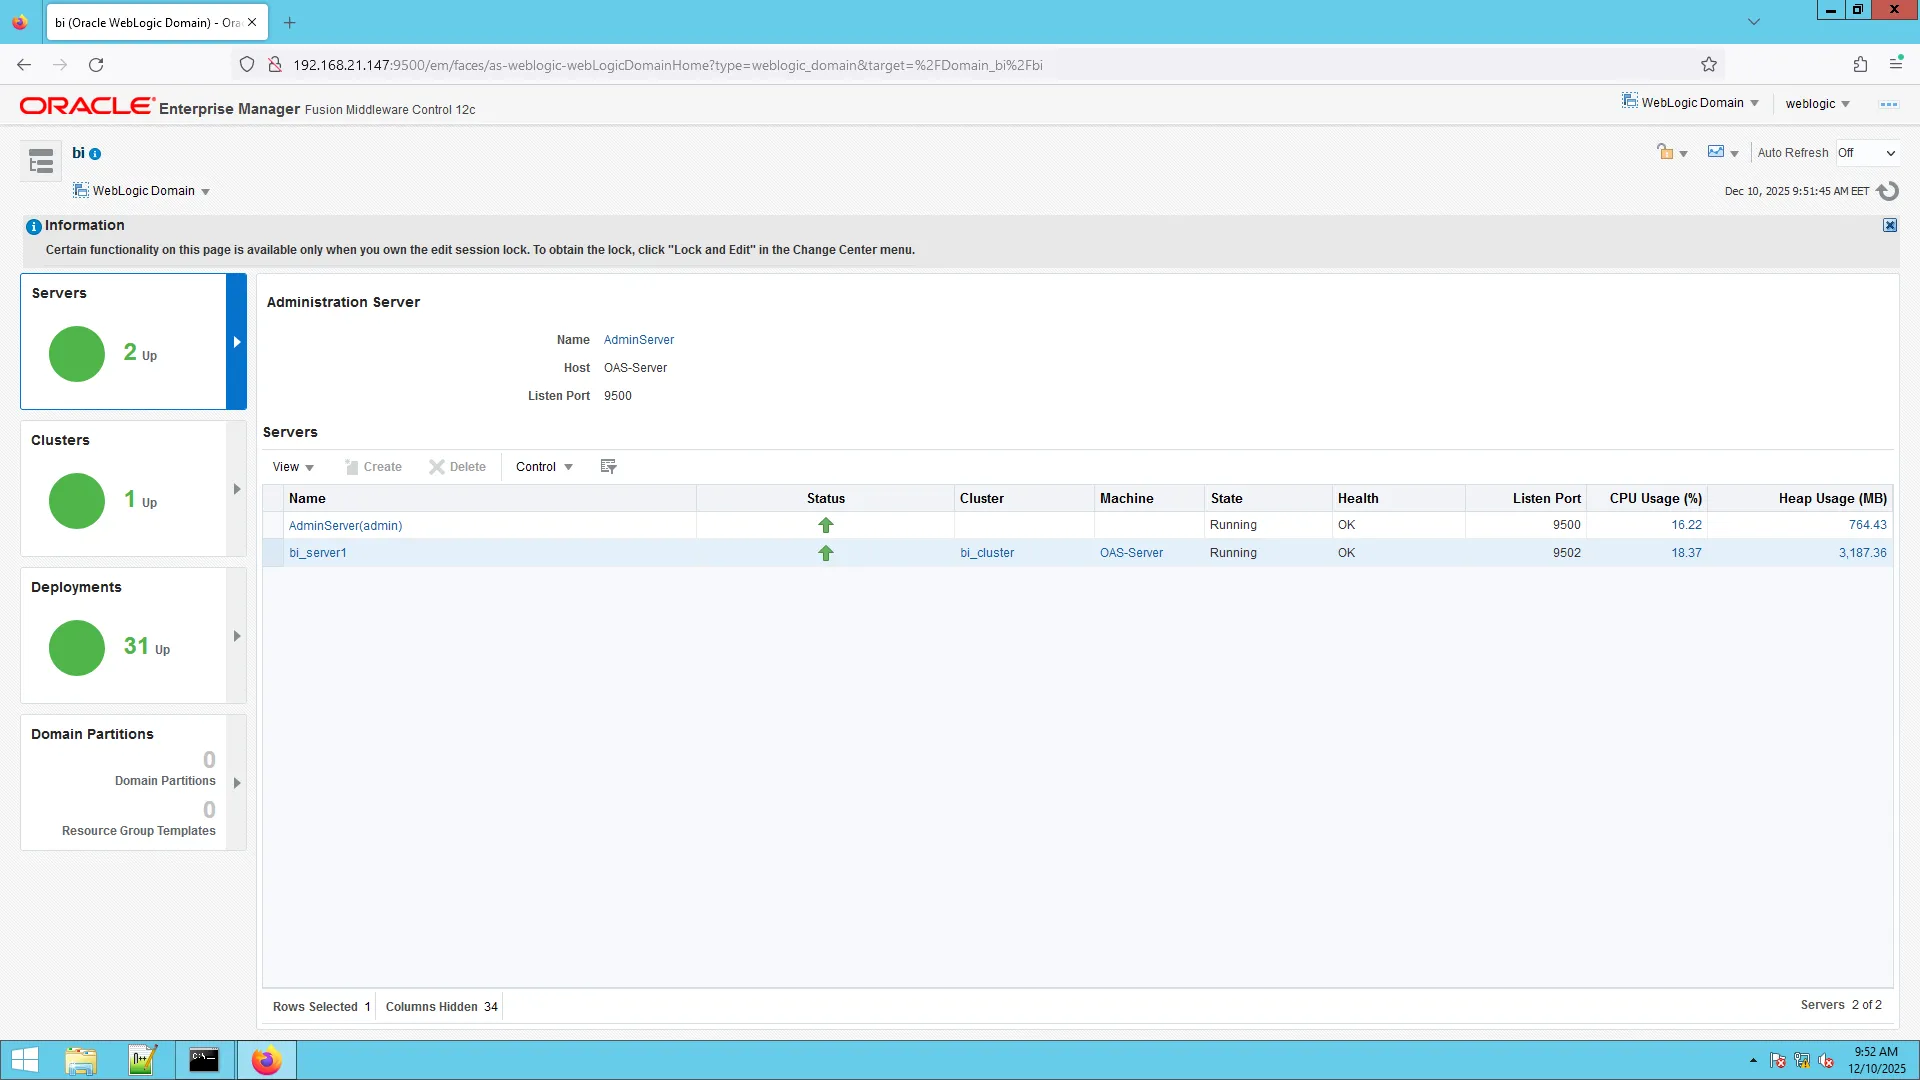
The following table outlines the Key Resources every administrator should monitor daily:
| Metric | Description | Why Monitor? |
| Status | Indicates if the server is Up (Running) or Down. | Immediate notification of outages. |
| Listen Port | The network port the server is listening on. | Ensures connectivity configurations are active. |
| CPU Usage % | Percentage of CPU resources currently consumed. | High usage may indicate runaway processes or need for scaling. |
| Java Heap Usage | Amount of memory used by the Java Virtual Machine. | Prevents OutOfMemory errors and garbage collection thrashing. |
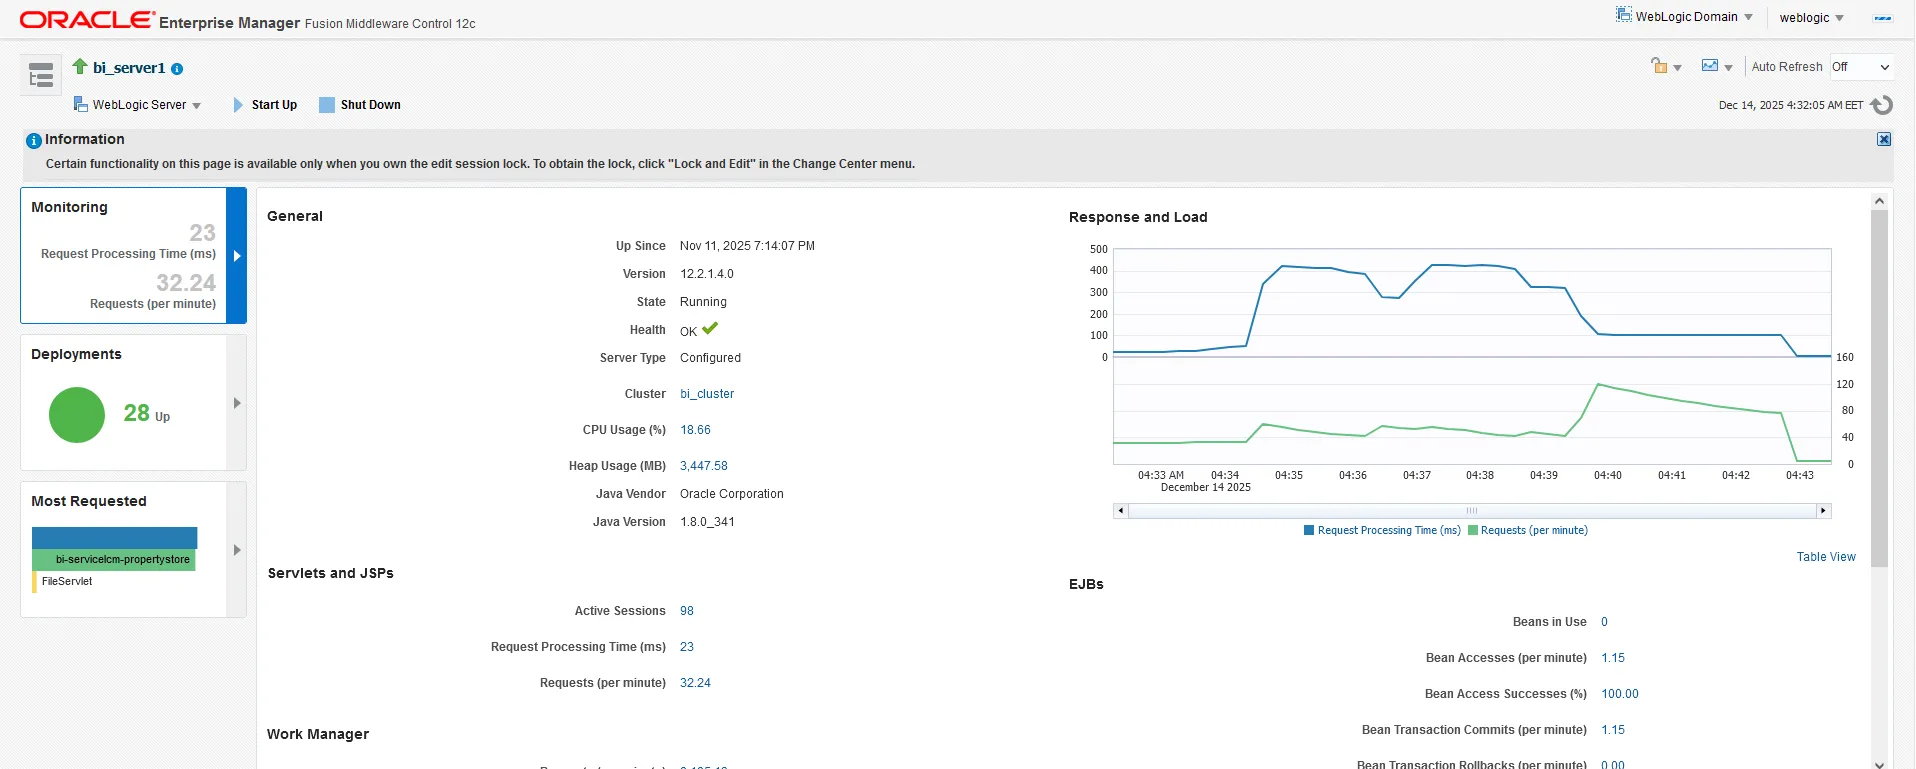
3. Investigating Server Performance
If high resource usage is detected in the general dashboard, you must drill down into specific servers for investigation.
Analyzing the AdminServer
Click on the AdminServer node to view detailed health statistics. This view provides a granular look at the JEE container’s health.

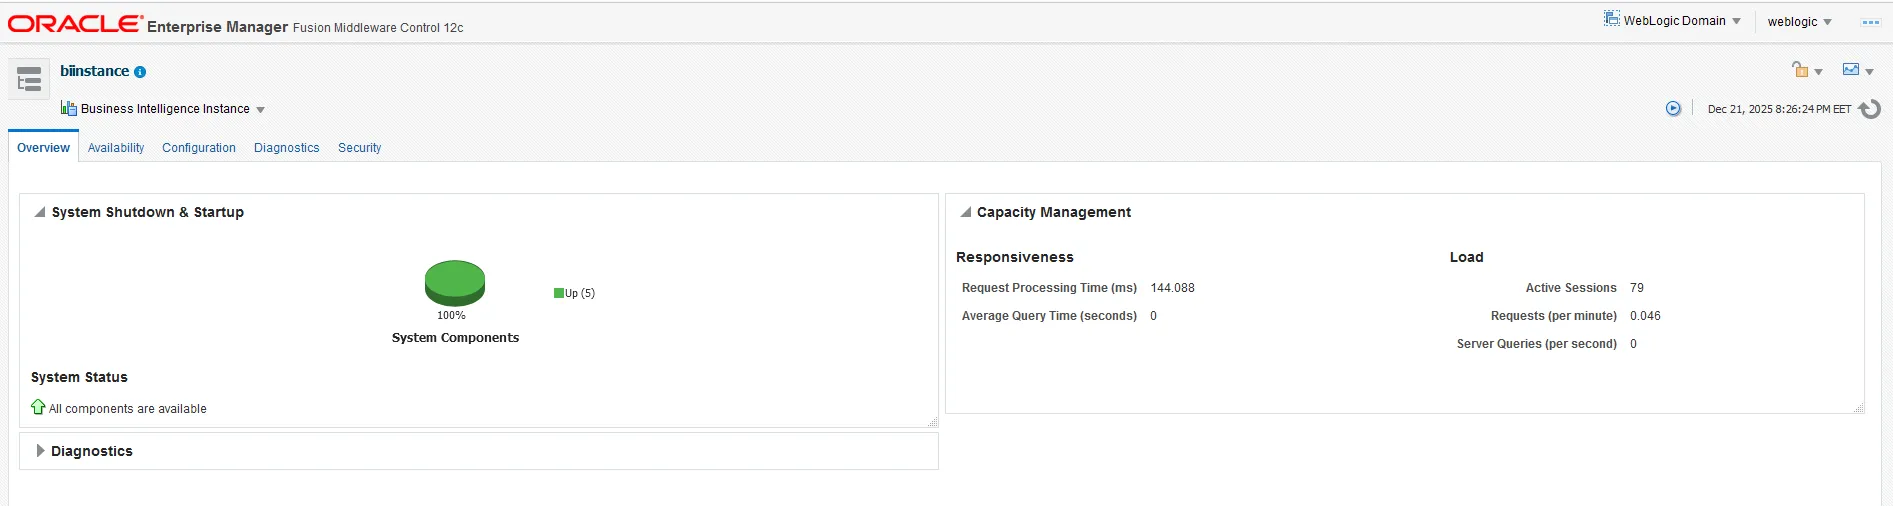
Analyzing the BI Instance
To get back to the main screen, click the Oracle Logo. Then, navigate to the biinstance node using the left-side tree. This view aggregates metrics specific to the Business Intelligence components.
Click Business Intelligence
4. Advanced Configuration and Tuning
Enterprise Manager allows for deep configuration changes to optimize performance and ensure reliability.
Performance Tuning
Navigate to Configuration -> Performance. Here you can adjust BI Server tuning parameters to match your hardware capabilities and user load.
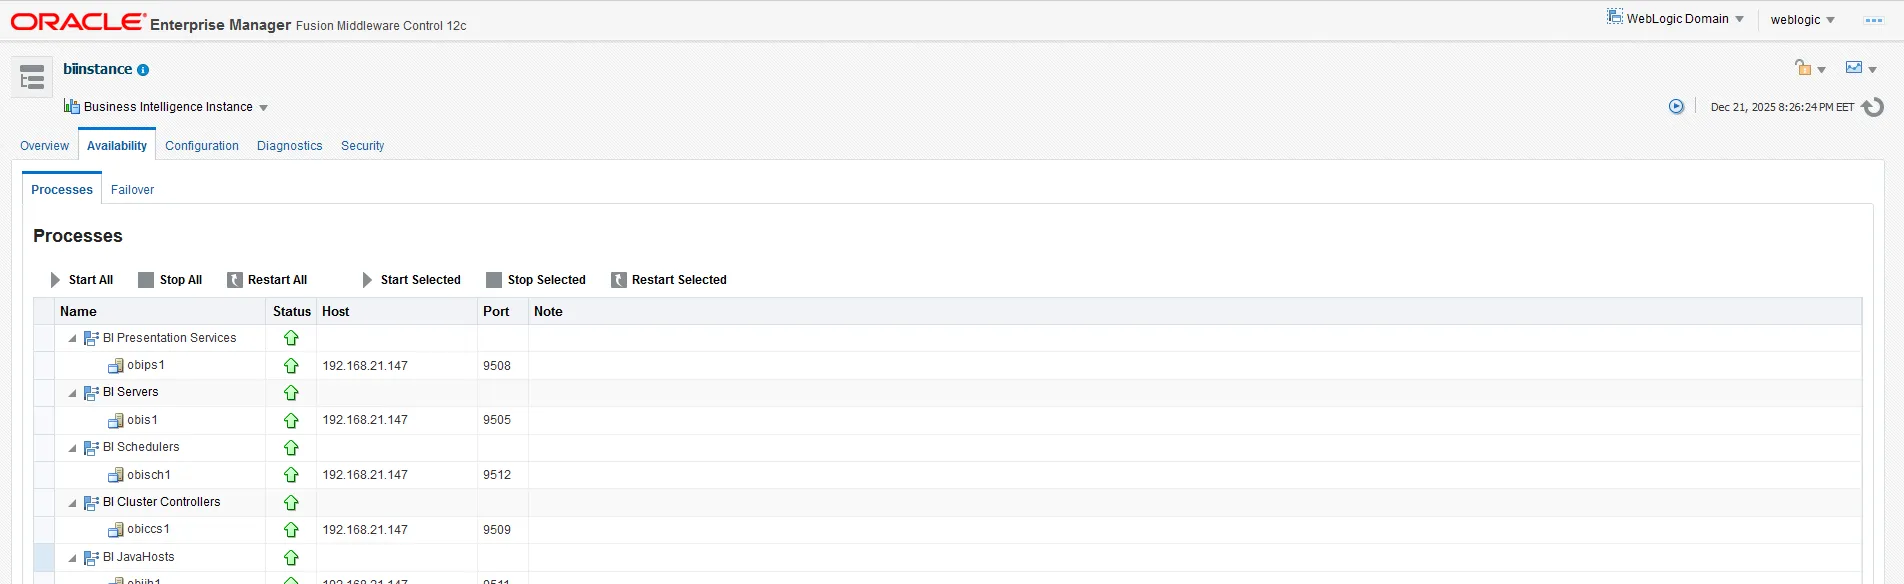
Availability Status
Click the Availability tab to view the status of system components. This view confirms that all sub-processes required for BI reporting are active.
Click Business Intelligence

Click biinstance
The following metrics are shown :
Click Availability tab to view the systems components status
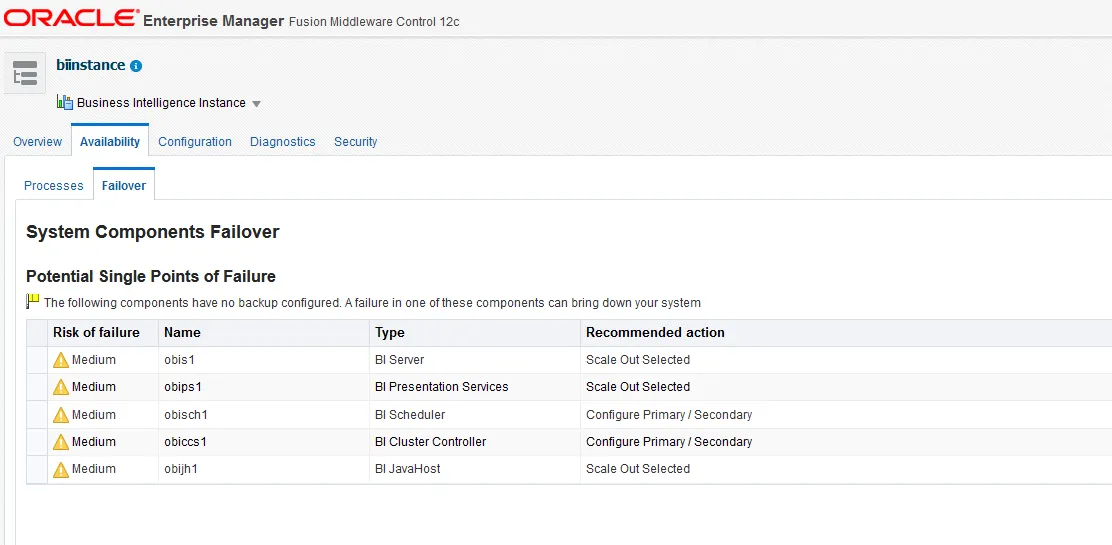
Failover and Scaling
Click the Failover tab. For production environments requiring high availability, it is highly recommended to Scale Out system components. This distributes the load and provides redundancy in case of a node failure.
Click Configuration -> Performance for BI Server tuning parameters :

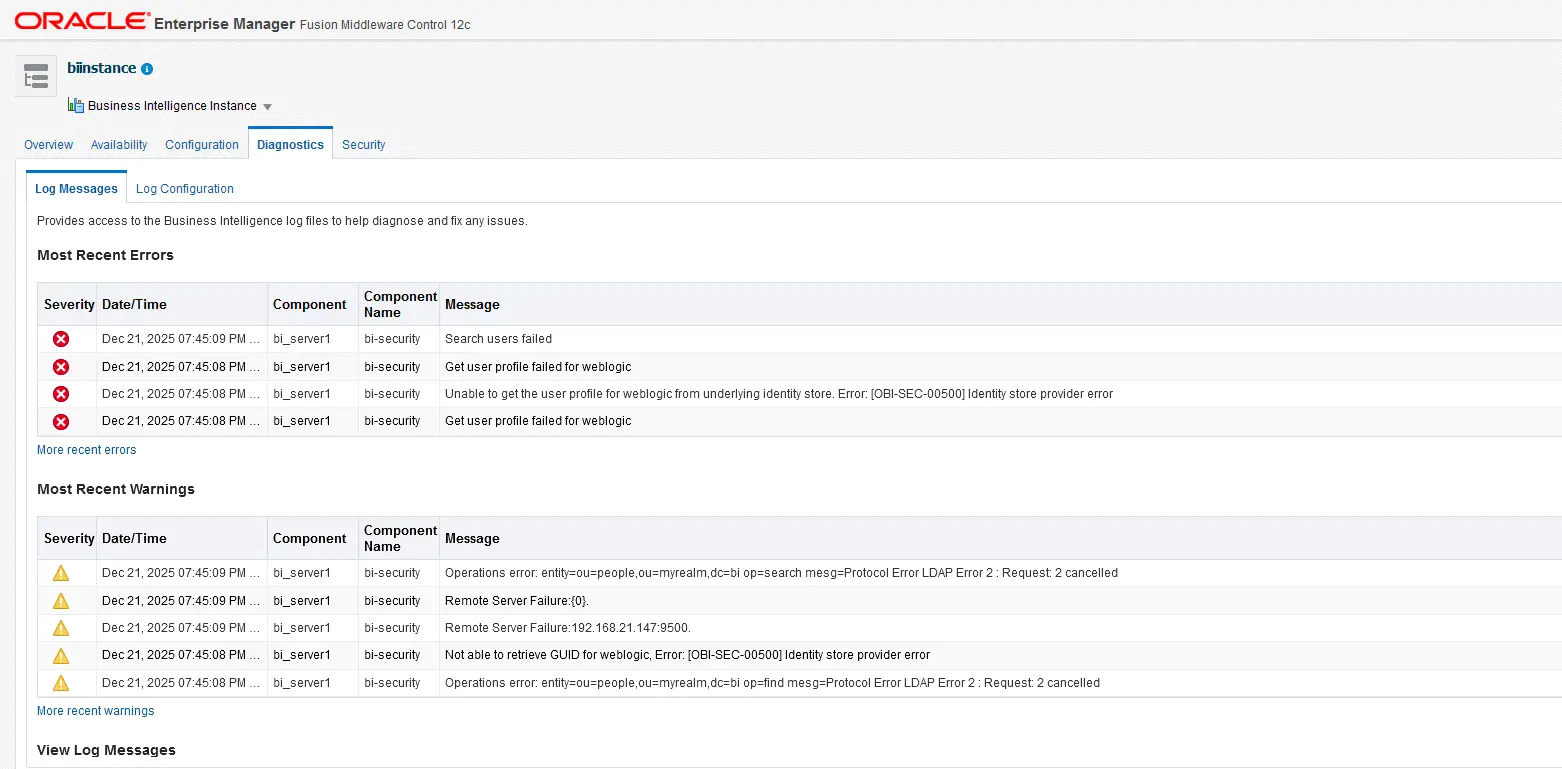
Click to view latest warnings, log messages:
Best Practices Resources
Check out official guides for handling administration, fine-tuning performance, and monitoring usage. Dive into Oracle’s infrastructure tuning PDF for advanced optimization tips. Community insights also highlight smart ways to track and boost performance. Source : Oracle
People Also Ask (FAQ)
- What is the difference between the Admin Server and Managed Server in OAS? The Admin Server is the central control point for configuring and managing the entire domain. The Managed Server (e.g., bi_server1) is the workhorse that hosts the actual applications like BI Publisher and Presentation Services.
- How do I troubleshoot high CPU usage in Oracle Analytics Server? First, check the Performance Summaryin EM to identify if the spike is on the Admin or Managed server. correlate the spike with active user sessions or scheduled reports. Review WebLogic logs for stuck threads.
- Can I monitor OAS without Enterprise Manager? Yes, you can use the WebLogic Server Administration Console for basic JEE monitoring or WLST (WebLogic Scripting Tool) for command-line monitoring, but EM provides the most comprehensive visual dashboard.
- What does “Scaling Out” mean in the context of OAS? Scaling out involves adding more Managed Servers to the BI Domain, often on different host machines. This increases capacity for more users and provides failover protection if one host goes down.
- Where are the logs located for OAS components? While EM provides a log viewer, raw logs are typically stored on the server file system under the user_projects/domains/bi/servers/[server_name]/logsdirectory.